
How to Track QR Code Scans and Understand QR Analytics
What a FreeQR dynamic QR code actually measures when someone scans it — total vs unique scans, countries, devices, browsers and referrers — plus the honest limits of each number.
“It got scanned” isn't really an answer. Scanned by how many people? From where? On a phone or a laptop? Is that more or less than last week? A QR code on a flyer, a menu or a piece of equipment is only useful to analyse if you can actually see what happened after someone pointed their camera at it — and that only works if the QR code can change what it points to without being reprinted, which is exactly what a dynamic QR code is for.
This guide explains what FreeQR's scan analytics actually measure, the honest limits of each number, and walks through the real Analytics dashboard with a live example — a demo QR code, scanned from five different devices and browsers, so every screenshot below is genuine FreeQR output, not a mockup.
Static vs dynamic: only one of them has analytics
A static QR code encodes its destination directly inside the pattern itself — your phone reads the URL straight out of the code, with no FreeQR server involved at the moment of scanning. That makes static QR codes free, unlimited and fast, but it also means there's nothing to count: FreeQR genuinely has no way of knowing a static QR code was scanned.
A dynamic QR code instead encodes a short FreeQR redirect link. Scanning it sends the request to FreeQR first, which looks up the current destination and redirects the scanner on to it — and because that request passes through FreeQR, it can be counted. This is also why a dynamic QR's destination can be changed after printing and a static one can't: the printed code only ever points at the FreeQR link, never at the destination itself.
What actually happens when someone scans a dynamic QR
Scanning a dynamic QR code hits q.freeqr.com.au/{your-link}, which immediately returns a redirect to your destination — that response is never delayed waiting on analytics. Recording the scan happens afterward, in the background: the device's country, device type, browser, operating system and referrer (if any) are read from that one request, and a privacy-preserving visitor hash is computed so a repeat scan from the same device on the same day doesn't get double-counted. None of that can slow down or break the redirect itself — a visitor always gets sent on to your destination even if analytics recording fails for any reason.
Bots and link previews don't count as scans
Where to find your analytics
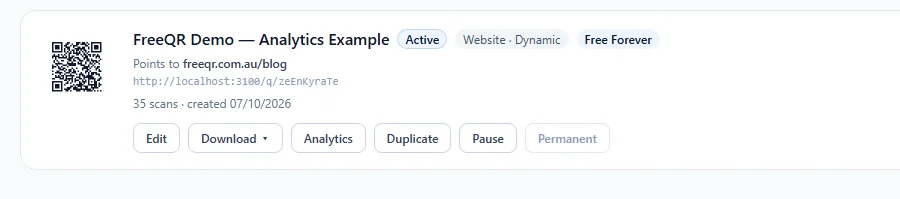
Every dynamic QR code shows its running scan total right on its card in My QR Codes, with a direct link into its full analytics:
Reading the Analytics dashboard
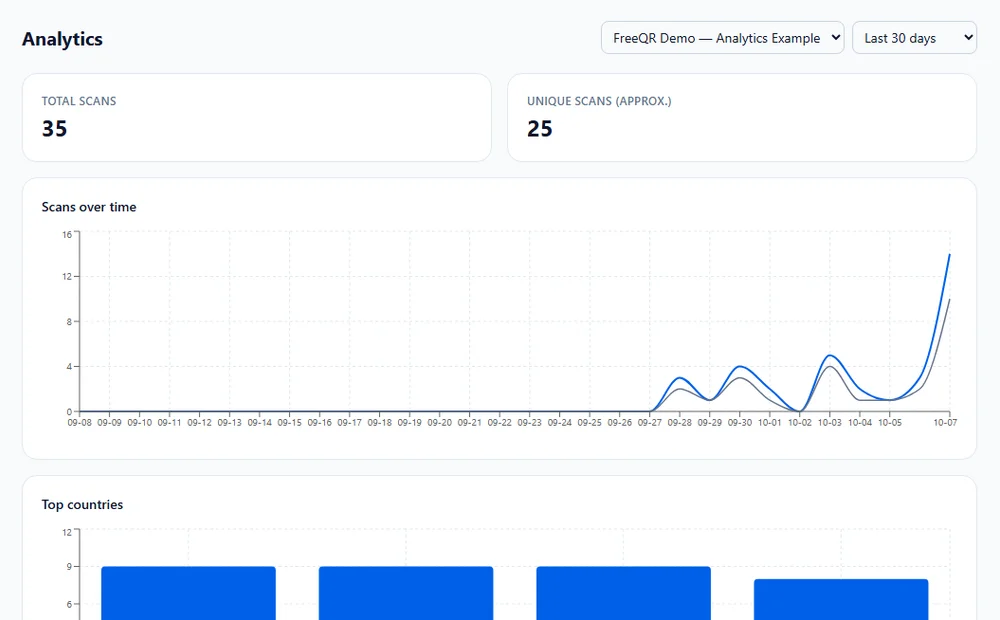
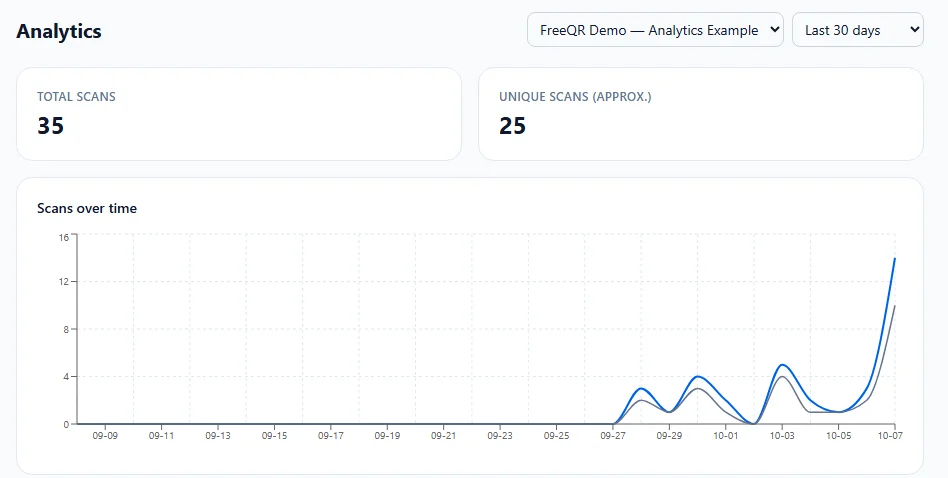
Pick a QR code and a date range (7/30/90 days, or 12 months) at the top of the Analytics page. Two headline numbers come first:
- Total scans — every redirect FreeQR served for that QR in the selected range, bots and previews already excluded.
- Unique scans (approx.) — an estimate of distinct visitors, using the rotating privacy hash described above. It's always labelled “approx.” because it's a same-device, same-day estimate, not a verified visitor count — someone scanning from two different devices, or on two different days, is counted twice.
Below that sits the scans-over-time chart — this is the real example QR used for this guide:
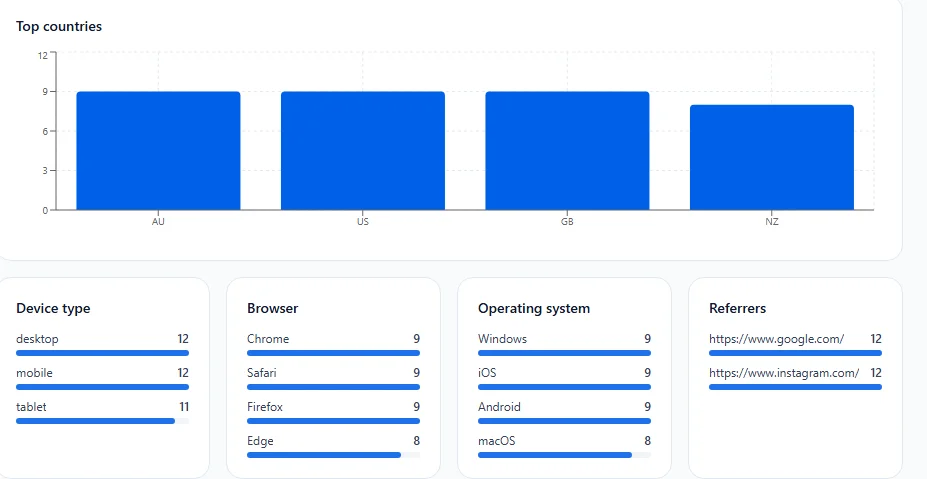
Further down, the same scans are broken out by top countries, device type, browser, operating system and referrer — useful for seeing whether a QR is mostly being scanned on mobile in the field, or from a desktop browser after being shared as a link, and which channel (a physical sign vs. a social post vs. an email) is actually driving scans:
A new QR code with no scans yet
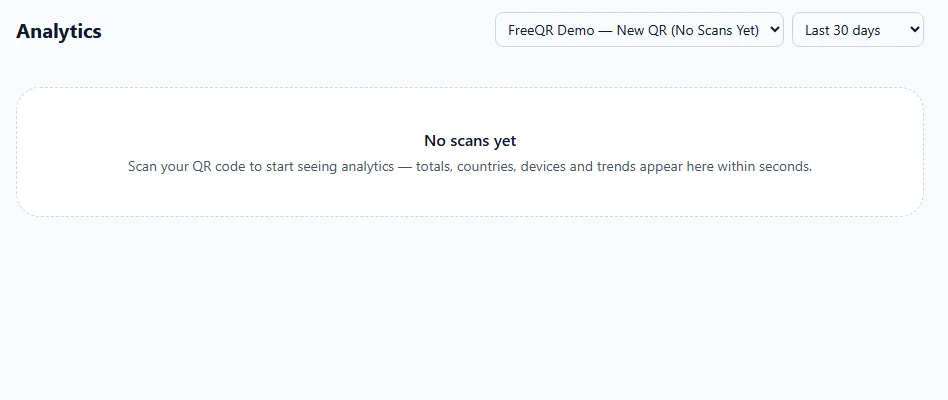
FreeQR never shows a fabricated chart or implies activity that hasn't happened. A brand-new QR code with nothing recorded yet says exactly that, instead of rendering an empty-looking chart with no explanation:
How this example was captured
Every screenshot in this guide is FreeQR's real Analytics UI, running against a demo QR code created specifically for this article and scanned from five different simulated devices/browsers (desktop Chrome, iPhone Safari, Android Chrome, desktop Safari and iPad Safari) with different referrers, so the breakdown charts above have something real to show. No customer data, account details or production records were used or exposed anywhere in this process.
Create (or pick) a dynamic QR code
Analytics only exist for dynamic QR codes. If you don't have one yet, your first dynamic QR is free forever — create it from + Create QR, choose a QR type, and switch to Dynamic.
Put it somewhere real
Print it, add it to packaging, put it on a sign, or share the link — anywhere a real person might actually scan it. The destination can be changed later without reprinting, so there's no cost to starting with your QR code live before the content behind it is finished.
Check back on Analytics
Scans typically appear within seconds. Come back to the Analytics page any time to see totals, the trend over your selected range, and the country/device/browser/referrer breakdowns.
Scan history by plan
How far back you can look is the only thing that differs by plan — the metrics themselves (total, unique, countries, devices, browsers, OS, referrers) are identical on every plan:
- Free: 30 days
- Starter: 90 days
- Pro, Business and Agency: full history, no cutoff
- A one-off Lifetime QR: at least 90 days, even on a Free workspace
See the full plan comparison for everything else each plan includes.
What FreeQR analytics won't tell you
To be upfront about the limits: unique scans are an estimate, not a precise visitor count. Location is read from the scanning request, not GPS — it can be approximate or occasionally unavailable, and FreeQR shows that honestly rather than guessing. There's no individual-level tracking across sessions or across different QR codes, and no raw IP address is ever stored — only the rotating hash used for the same-day unique estimate. If you need session replay, heatmaps or cross-site visitor tracking, that's a different category of tool entirely; FreeQR tells you how a QR code performed, not everything a visitor did afterward.
Frequently asked questions
- Do static QR codes have scan analytics?
- No. A static QR encodes its content directly — there's no FreeQR server in the middle of a scan, so there's nothing to count. Only dynamic QR codes (which redirect through a short FreeQR link) have scan analytics.
- What counts as a "scan"?
- Any request that reaches the redirect link and gets sent on to your destination. FreeQR excludes known bots, crawlers and link-preview fetchers (like Googlebot, Slackbot or WhatsApp's link unfurler) from scan counts, so a QR code posted in a chat app doesn't get inflated by the chat app itself fetching a preview.
- How is "unique scans" calculated if FreeQR doesn't store IP addresses?
- FreeQR hashes the scanning device's IP and user agent together with a secret, rotated daily, and never stores the raw IP at all — only that one-way hash. The same device scanning twice in the same day produces the same hash and is only counted once; a new day starts a fresh hash. It's a privacy-preserving estimate, not a precise visitor count — presented as "approx." for exactly that reason.
- Why does my QR code show "Local" or "Unknown" as the country?
- Country is read from the scanning request at the edge. If that signal genuinely isn't available for a particular request, FreeQR shows it honestly as unknown rather than guessing — it never invents a country to avoid an empty-looking chart.
- How long is my scan history kept?
- It depends on your plan: 30 days on Free, 90 days on Starter, and full history with no cutoff on Pro, Business and Agency. A one-off Lifetime QR carries at least a 90-day analytics window even on a Free workspace. This is a dashboard visibility window, not a claim that older data is instantly deleted the moment a window passes.
- Can I see which device, browser or operating system people are scanning from?
- Yes — the Analytics page breaks scans down by device type (desktop/mobile/tablet), browser and operating system, read from the scanning device's own user agent string.
- Does scanning analytics slow down the redirect?
- No. The redirect is returned immediately; recording the scan happens afterward in the background. A slow or failed analytics write can never delay or break someone's redirect.
- Do Equipment Passports and Sign-In QR codes use the same analytics?
- Yes — Equipment Passports and FreeQR's Sign-In Solutions are built on the same dynamic QR engine, so the same scan-counting and analytics pipeline applies, it's just surfaced in context on the equipment or site dashboard instead of the general Analytics page.